The Fear and Greed Index for India
Fetching the latest Market Mood Index data…
| Now | Loading… |
| Yesterday | Loading… |
| Last Week | Loading… |
| Last Month | Loading… |
| Last Year | Loading… |
| Year High | Loading… |
| Year Low | Loading… |
| All-Time High | Loading… |
| All-Time Low | Loading… |
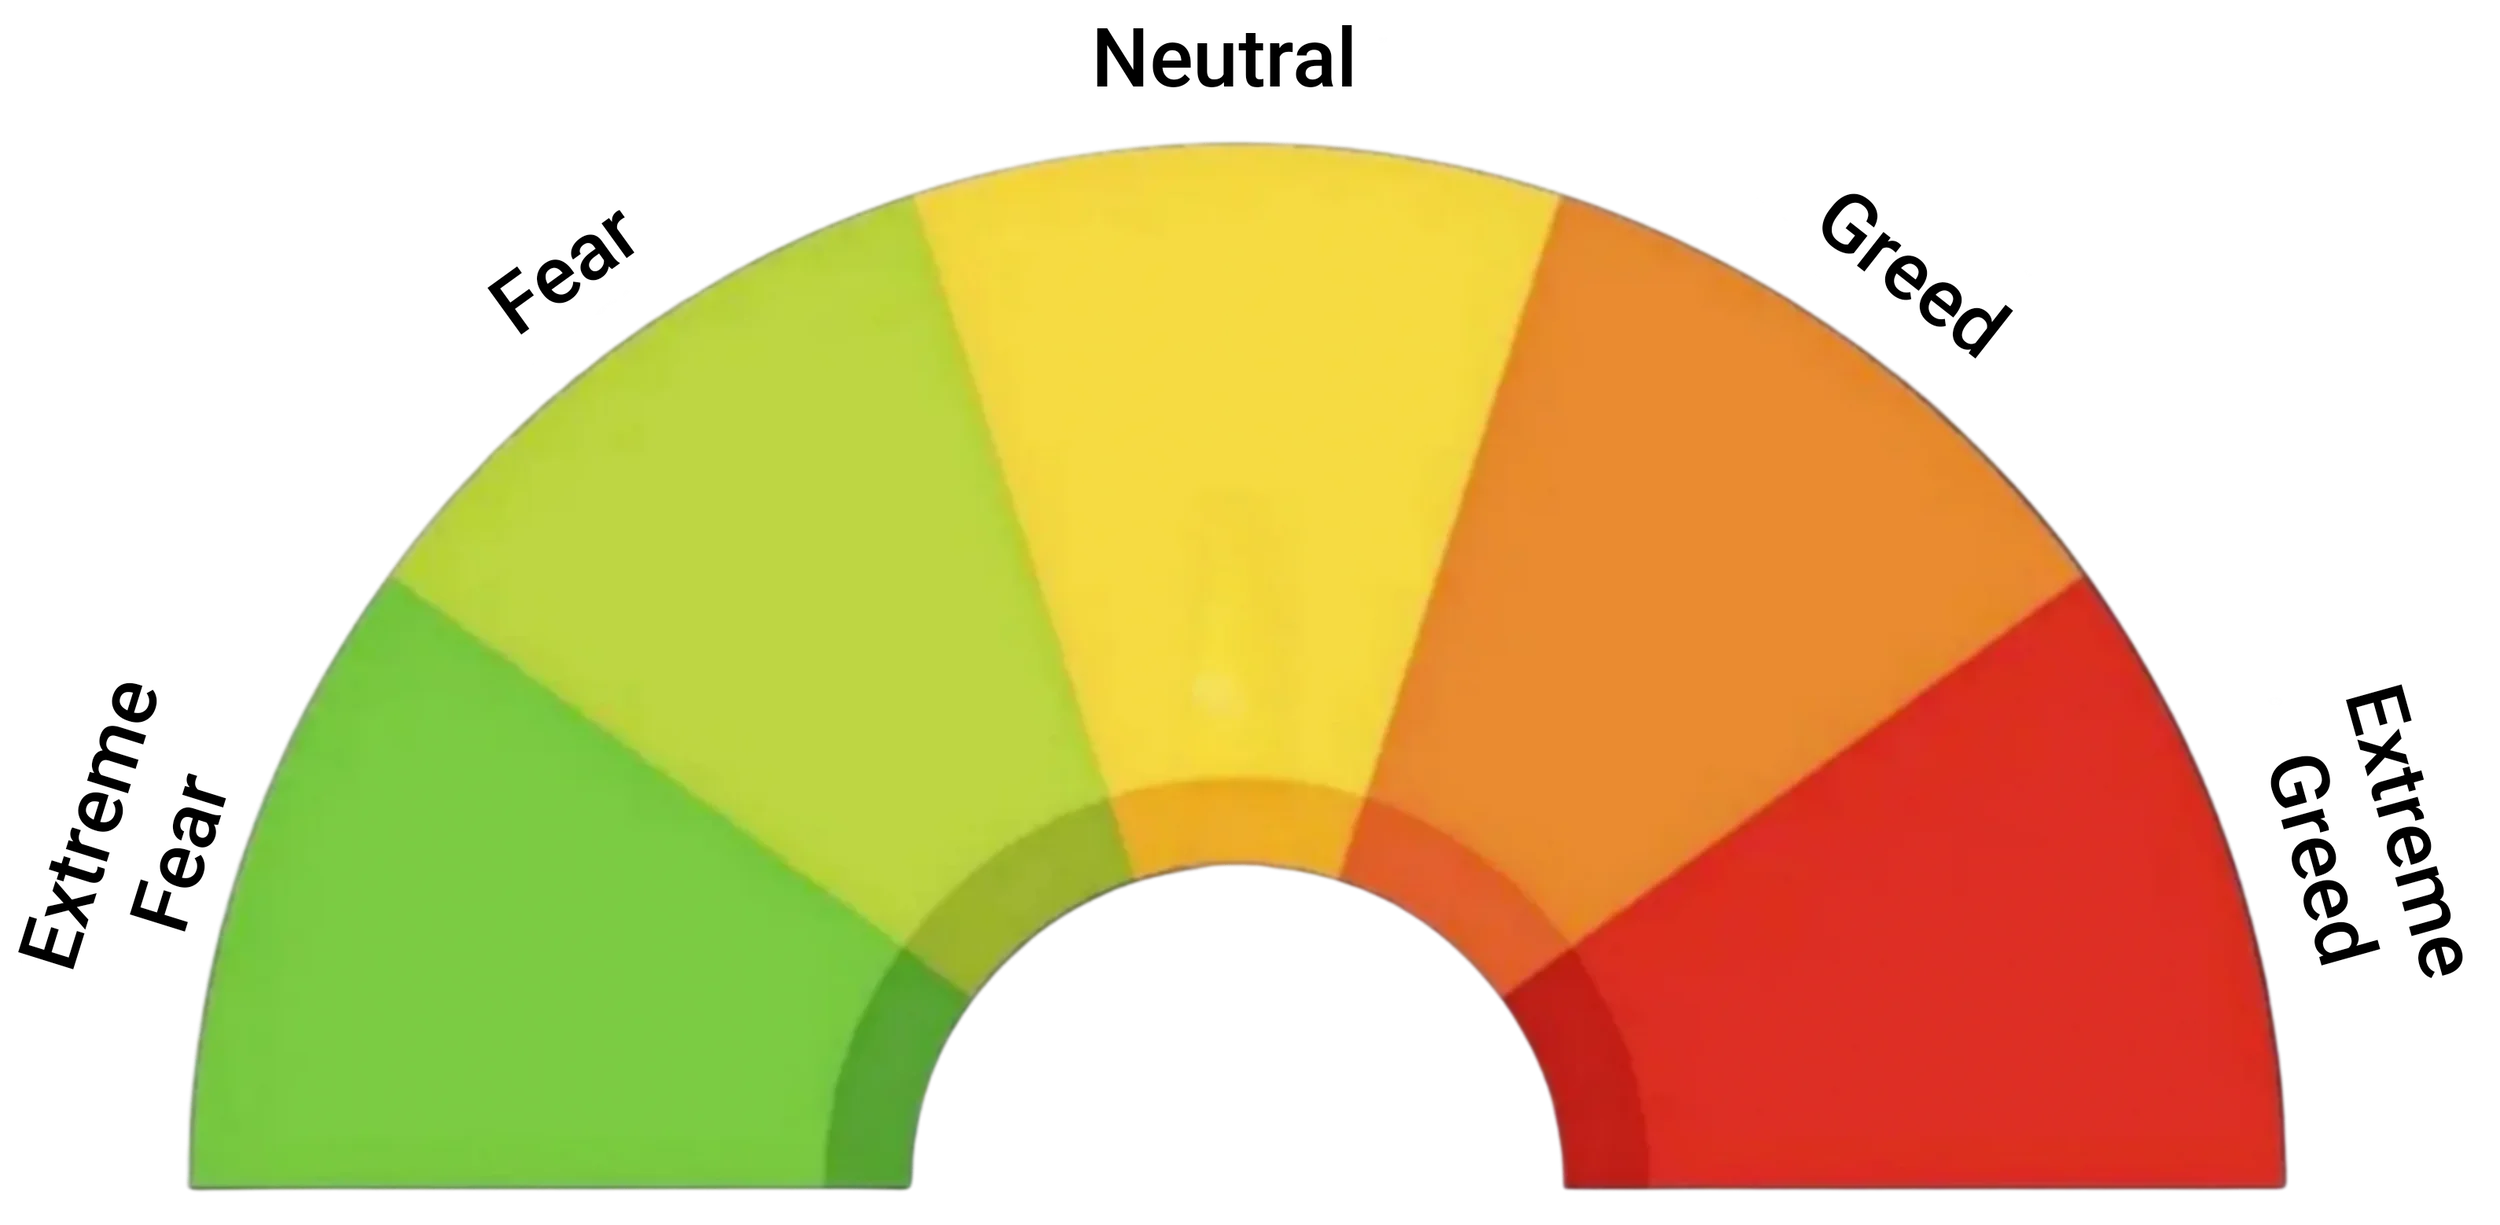
| Value Range | Sentiment |
|---|---|
| 0 – 24 | Extreme Fear |
| 25 – 44 | Fear |
| 45 – 55 | Neutral |
| 56 – 74 | Greed |
| 75 – 100 | Extreme Greed |
| Updated: | Value = , |
Market Mood Index Chart
Market Mood Index Distribution
What is Market Mood Index?
The Market Mood Index (MMI) is a sentiment indicator that measures the emotions driving stock market movements. It is the Indian version of Fear and Greed Index. MMI provides investors with a comprehensive picture of market sentiment, ranging from Extreme Fear to Extreme Greed, by analyzing six key factors.
How is Market Mood Index Calculated?
MMI is based on six important market factors that influence investor sentiment:
1. FII Activity
This measures the net open interest of Foreign Institutional Investors (FIIs) in Index Futures on the NSE. Tracking FII movements provides insights into their market outlook.
- Higher-than-average FII activity suggests bullish market sentiment.
- Lower-than-average activity may indicate cautious or bearish sentiment.
2. Volatility and Skew
- Volatility is measured using the India VIX index, which reflects the implied volatility of 1-month Nifty 50 options.
- Skew is calculated as the difference between the implied volatilities (IV) of out-of-the-money (OTM) put options and OTM call options on Nifty 50.
How it impacts MMI:
- High VIX values indicate expectations of increased market volatility.
- Skew helps determine direction:
- Higher-than-average skew suggests a higher probability of downward movement.
- Lower-than-average skew suggests a higher probability of upward movement.
3. Momentum
Momentum is calculated as the difference between the 90-day and 30-day exponential moving averages (EMAs) of Nifty 50, divided by the 90-day EMA.
- A positive value indicates an uptrend in the market.
- A negative value signals a downtrend.
4. Market Breadth
This is measured using the Modified Arms Index, calculated by dividing the Advance-Decline (AD) Ratio by AD Volume.
- A low Market Breadth value (<1) suggests that market movements are supported by strong trading volumes, indicating a stable trend.
5. Price Strength
Price strength is calculated by subtracting the percentage of stocks near their 52-week low from the percentage of stocks near their 52-week high.
- Higher values indicate that more stocks are near their 52-week highs, suggesting strong market performance.
- Lower values suggest that stocks are closer to their lows, indicating weaker sentiment.
6. Demand for Gold
This factor measures the relative price return of Gold vs. Nifty 50 over the last two weeks.
- If gold prices rise faster than Nifty 50, it indicates investors are shifting away from equities into safer assets, signaling risk aversion.
- If Nifty 50 outperforms gold, investors are confident in the stock market.
Why is Market Mood Index Important?
- Identifies Market Trends – Helps predict bullish or bearish phases.
- Aids in Risk Management – Warns against excessive optimism or panic selling.
- Improves Investment Timing – Guides investors on when to enter or exit positions.
How to Interpret the Market Mood Index?
- Extreme Fear (0-24): Markets are in panic mode—potential buying opportunities.
- Fear (25-44): Caution is advised as investors are risk-averse.
- Neutral (45-55): Balanced market sentiment.
- Greed (56-74): Optimism is rising, but valuations may be stretched.
- Extreme Greed (75-100): High speculation—market corrections may follow.
“Be fearful when others are greedy & greedy when others are fearful.”
— Warren Buffett (also known for the Buffett Indicator)
That’s why we launched Fear and Greed Index with all essential features to help you know whether others are felling greedy or fearful. Additionally, all the charts, historical data with download option is available for free without any subscription requirement.
The Market Mood Index is a powerful sentiment gauge for investors, offering real-time insights into market behavior. By tracking key indicators like FII activity, volatility, momentum, market breadth, price strength, and gold demand, traders can make informed decisions and manage risk effectively.
The Market Mood Index shows Indian stock market sentiment. You can also look at the US Stock Market and the Crypto Index values at our main Fear and Greed Index.
With Market Mood Index Live, data updates every 3 minutes in real-time. It means during Indian market hours, the update frequency is 3 minutes, while in off-market hours, it updates every 1 hour. You can always verify the last updated time by seeing the Updated date in the second table at the top of the website.